my requests process is higher than requests in
- Thread starter hichew
- Start date
and i found this error (on error.log)
root@web [/usr/local/lsws/logs]# tail error.log
2007-10-20 23:54:09.010 [NOTICE] [APVH_www.********.usSuphp:] Send SIGTERM to process [32667].
2007-10-20 23:54:09.010 [NOTICE] [APVH_www.********.usSuphp:] Send SIGTERM to process [31964].
2007-10-20 23:54:09.010 [NOTICE] [APVH_www.********.usSuphp:] Send SIGTERM to process [760].
2007-10-20 23:54:09.010 [NOTICE] [APVH_www.********.usSuphp:] Send SIGTERM to process [959].
2007-10-20 23:54:11.017 [NOTICE] [APVH_www.********.usSuphp:] Send SIGTERM to process [975].
2007-10-20 23:54:11.017 [NOTICE] [APVH_www.********.usSuphp:] Send SIGTERM to process [793].
2007-10-20 23:54:11.017 [NOTICE] [APVH_www.********.usSuphp:] Send SIGTERM to process [687].
2007-10-20 23:54:12.021 [NOTICE] [APVH_www.********.usSuphp:] Send SIGTERM to process [971].
2007-10-20 23:54:12.021 [NOTICE] [APVH_www.********.usSuphp:] Send SIGTERM to process [585].
2007-10-20 23:54:12.021 [NOTICE] [APVH_www.********.usSuphp:] Send SIGTERM to process [972].
root@web [/usr/local/lsws/logs]# tail error.log
2007-10-20 23:54:11.017 [NOTICE] [APVH_www.********.usSuphp:] Send SIGTERM to process [793].
2007-10-20 23:54:11.017 [NOTICE] [APVH_www.********.usSuphp:] Send SIGTERM to process [687].
2007-10-20 23:54:12.021 [NOTICE] [APVH_www.********.usSuphp:] Send SIGTERM to process [971].
2007-10-20 23:54:12.021 [NOTICE] [APVH_www.********.usSuphp:] Send SIGTERM to process [585].
2007-10-20 23:54:12.021 [NOTICE] [APVH_www.********.usSuphp:] Send SIGTERM to process [972].
2007-10-20 23:54:45.061 [NOTICE] [APVH_www.********.usSuphp:] Send SIGTERM to process [1017].
2007-10-20 23:54:45.061 [NOTICE] [APVH_www.********.usSuphp:] Send SIGTERM to process [32535].
2007-10-20 23:54:45.061 [NOTICE] [APVH_www.********.usSuphp:] Send SIGTERM to process [725].
2007-10-20 23:54:45.061 [NOTICE] [APVH_www.********.usSuphp:] Send SIGTERM to process [32215].
2007-10-20 23:54:48.018 [NOTICE] [APVH_www.********.usSuphp:] Send SIGTERM to process [1041].
root@web [/usr/local/lsws/logs]# tail error.log
2007-10-20 23:54:09.010 [NOTICE] [APVH_www.********.usSuphp:] Send SIGTERM to process [32667].
2007-10-20 23:54:09.010 [NOTICE] [APVH_www.********.usSuphp:] Send SIGTERM to process [31964].
2007-10-20 23:54:09.010 [NOTICE] [APVH_www.********.usSuphp:] Send SIGTERM to process [760].
2007-10-20 23:54:09.010 [NOTICE] [APVH_www.********.usSuphp:] Send SIGTERM to process [959].
2007-10-20 23:54:11.017 [NOTICE] [APVH_www.********.usSuphp:] Send SIGTERM to process [975].
2007-10-20 23:54:11.017 [NOTICE] [APVH_www.********.usSuphp:] Send SIGTERM to process [793].
2007-10-20 23:54:11.017 [NOTICE] [APVH_www.********.usSuphp:] Send SIGTERM to process [687].
2007-10-20 23:54:12.021 [NOTICE] [APVH_www.********.usSuphp:] Send SIGTERM to process [971].
2007-10-20 23:54:12.021 [NOTICE] [APVH_www.********.usSuphp:] Send SIGTERM to process [585].
2007-10-20 23:54:12.021 [NOTICE] [APVH_www.********.usSuphp:] Send SIGTERM to process [972].
root@web [/usr/local/lsws/logs]# tail error.log
2007-10-20 23:54:11.017 [NOTICE] [APVH_www.********.usSuphp:] Send SIGTERM to process [793].
2007-10-20 23:54:11.017 [NOTICE] [APVH_www.********.usSuphp:] Send SIGTERM to process [687].
2007-10-20 23:54:12.021 [NOTICE] [APVH_www.********.usSuphp:] Send SIGTERM to process [971].
2007-10-20 23:54:12.021 [NOTICE] [APVH_www.********.usSuphp:] Send SIGTERM to process [585].
2007-10-20 23:54:12.021 [NOTICE] [APVH_www.********.usSuphp:] Send SIGTERM to process [972].
2007-10-20 23:54:45.061 [NOTICE] [APVH_www.********.usSuphp:] Send SIGTERM to process [1017].
2007-10-20 23:54:45.061 [NOTICE] [APVH_www.********.usSuphp:] Send SIGTERM to process [32535].
2007-10-20 23:54:45.061 [NOTICE] [APVH_www.********.usSuphp:] Send SIGTERM to process [725].
2007-10-20 23:54:45.061 [NOTICE] [APVH_www.********.usSuphp:] Send SIGTERM to process [32215].
2007-10-20 23:54:48.018 [NOTICE] [APVH_www.********.usSuphp:] Send SIGTERM to process [1041].
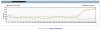
i just optimize the db and the db load is now fine...
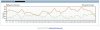
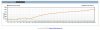
but the webserver load is still high...
so i think the problem is on the webserver.
any idea?
top - 22:21:08 up 196 days, 10:26, 1 user, load average: 3.50, 3.72, 3.12
Tasks: 79 total, 1 running, 78 sleeping, 0 stopped, 0 zombie
Cpu0 : 16.9% us, 9.9% sy, 0.0% ni, 69.8% id, 1.3% wa, 0.0% hi, 2.0% si
Cpu1 : 12.8% us, 6.5% sy, 0.0% ni, 78.5% id, 1.4% wa, 0.0% hi, 0.9% si
Cpu2 : 5.4% us, 4.0% sy, 0.0% ni, 88.3% id, 2.2% wa, 0.0% hi, 0.1% si
Cpu3 : 8.6% us, 4.7% sy, 0.0% ni, 82.8% id, 3.7% wa, 0.0% hi, 0.1% si
Cpu4 : 9.6% us, 4.8% sy, 0.0% ni, 83.2% id, 2.3% wa, 0.0% hi, 0.1% si
Cpu5 : 7.8% us, 4.2% sy, 0.0% ni, 85.6% id, 2.3% wa, 0.0% hi, 0.1% si
Cpu6 : 6.4% us, 3.3% sy, 0.0% ni, 89.6% id, 0.7% wa, 0.0% hi, 0.1% si
Cpu7 : 7.1% us, 4.1% sy, 0.0% ni, 85.0% id, 3.7% wa, 0.0% hi, 0.1% si
Mem: 8165424k total, 8106664k used, 58760k free, 27928k buffers
Swap: 2031608k total, 7776k used, 2023832k free, 7112252k cached
PID USER PR NI VIRT RES SHR S %CPU %MEM TIME+ COMMAND
6894 mysql 15 0 1477m 814m 3932 S 267 10.2 173:56.58 mysqld
1 root 16 0 4748 80 48 S 0 0.0 0:17.16 init
2 root RT 0 0 0 0 S 0 0.0 0:02.86 migration/0
3 root 34 19 0 0 0 S 0 0.0 0:02.61 ksoftirqd/0
but the webserver load is still high...
top - 21:14:35 up 25 days, 23:58, 1 user, load average: 39.31, 27.48, 19.33
Tasks: 226 total, 50 running, 172 sleeping, 0 stopped, 4 zombie
Cpu0 : 28.3% us, 4.2% sy, 0.0% ni, 57.6% id, 0.0% wa, 0.1% hi, 9.8% si
Cpu1 : 30.3% us, 4.6% sy, 0.0% ni, 64.8% id, 0.0% wa, 0.0% hi, 0.3% si
Cpu2 : 33.5% us, 4.1% sy, 0.0% ni, 62.1% id, 0.1% wa, 0.0% hi, 0.2% si
Cpu3 : 31.6% us, 4.2% sy, 0.0% ni, 63.9% id, 0.0% wa, 0.0% hi, 0.3% si
Cpu4 : 30.2% us, 4.0% sy, 0.0% ni, 65.6% id, 0.0% wa, 0.0% hi, 0.3% si
Cpu5 : 30.0% us, 4.0% sy, 0.0% ni, 65.7% id, 0.0% wa, 0.0% hi, 0.3% si
Cpu6 : 31.6% us, 3.9% sy, 0.0% ni, 64.2% id, 0.0% wa, 0.0% hi, 0.3% si
Cpu7 : 31.5% us, 3.9% sy, 0.0% ni, 64.3% id, 0.0% wa, 0.0% hi, 0.3% si
Mem: 8165364k total, 7129896k used, 1035468k free, 253584k buffers
Swap: 2031608k total, 0k used, 2031608k free, 4820100k cached
PID USER PR NI VIRT RES SHR S %CPU %MEM TIME+ COMMAND
so i think the problem is on the webserver.
any idea?