We have recently migrated from CentOS5 to CentOS7.
Our current LiteSpeed Version is 5.1.12, and we also use CloudLinux to use an older version of PHP.
For the most part everything is working perfectly, and the server is responding very fast.
However, occasionally the server will just stop responding. When you try to load a page, it will just hang and continuously load. The only solution so far has been to restart LiteSpeed, in some cases we need to restart LiteSpeed twice before the server will load pages again.
There is a line in STDERR log that seems to line up with the issue, and it reads:
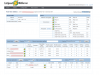
Looking under LS Admin > Server > External App > lsphp5 > Environment, we have these settings:
Is there somewhere else I need to increase the LSAPI_CHILDREN limit?
This is what is in our error_log around the same, there are many of these that all look very similar.
Would love some help as this issue is effecting our site tremendously.
Thanks in advance
Our current LiteSpeed Version is 5.1.12, and we also use CloudLinux to use an older version of PHP.
For the most part everything is working perfectly, and the server is responding very fast.
However, occasionally the server will just stop responding. When you try to load a page, it will just hang and continuously load. The only solution so far has been to restart LiteSpeed, in some cases we need to restart LiteSpeed twice before the server will load pages again.
There is a line in STDERR log that seems to line up with the issue, and it reads:
Code:
[STDERR] Reached max children process limit: 10, extra: 3, current: 13, please increase LSAPI_CHILDREN.
Code:
PHP_LSAPI_MAX_REQUESTS=5000
PHP_LSAPI_CHILDREN=35This is what is in our error_log around the same, there are many of these that all look very similar.
Code:
2017-02-15 07:30:16.570 [INFO] [123.45.647.89:2949] Connection idle time: 121 while in state: 6 stream flag: 0,close!
2017-02-15 07:30:16.570 [NOTICE] [123.45.647.89:2949] Content len: 0, Request line: 'GET /forums/showthread.php?123456-Embarrassing-moments-when-you-ve-done-a-Gary/page17 HTTP/1.1'
2017-02-15 07:30:16.570 [INFO] [123.45.647.89:2949] Cookie len: 313, bb_lastvisit=1486664710; bb_lastactivity=0; bb_forum_view=88162576a8efd707c7996c274f222a5efe608353a-1-%7Bi-199_i-1486677994_%7D; bb_sessionhash=5865fb613d
9f88827c25c65e2236fa90; bb_thread_lastview=3b98a16bfbeaaf1a2b1bd28d6193163729638339a-3-%7Bi-559835_i-1486691650_i-559747_i-1486683716_i-447786_i-1486793649_%7D
2017-02-15 07:30:16.570 [INFO] [123.45.647.89:2949] HttpExtConnector state: 8, request body sent: 0, response body size: -2, response body sent:0, left in buffer: 0, attempts: 0.
2017-02-15 07:30:16.570 [INFO] [123.45.647.89:2949] Lsapi connection state: 3, watching event: 25, respState: 1, m_iTotalPending:0, m_iPacketLeft:0, m_iCurRespHeader:2, req sent for 56 seconds,Total processing time: 56.
2017-02-15 07:30:16.570 [INFO] [123.45.647.89:2949] abort request..., code: 4
2017-02-15 07:30:16.570 [INFO] [123.45.647.89:2949] Abort request processing by PID:83579, kill: 1, begin time: 56, sent time: 56, req processed: 5Thanks in advance