This is an old revision of the document!
By default , LSCWP built-in crawler will add an URI into blacklist if following conditions are met:
1. the page is not cache by design or default , in other word, any pages that sends response header x-litespeed-cache-control: no-cache will be added into blacklist after initial crawling.
2. If the page is not responding the following headers:
HTTP/1.1 200 OK
HTTP/1.1 201 Created
HTTP/2 200
HTTP/2 201
One Real Debug Case:
Problem:
a user reports some pages are always being added into blacklist after first crawling, although manually use curl or Chrome browser , it always shows x-litespeed-cache header and 200 OK status code, but there are always dozens of URIs being added into blacklist when doing crawl.
Analyze:
So as mentioned above , we know the condition why it is blacklist , so we just need to figure what happened to trigger crawler to add it into blacklist.
Investigation:
Upon the checking debug log , but apparently it didn't log the response header, so we will need a little modification.
So we add a line to log more by inserting following code into file litespeed-cache/lib/litespeed/litespeed-crawler.class.php at line 273
LiteSpeed_Cache_Log::debug( 'crawler logs headers', $headers ) ;
This way , we will get the $headers when crawler deals it.
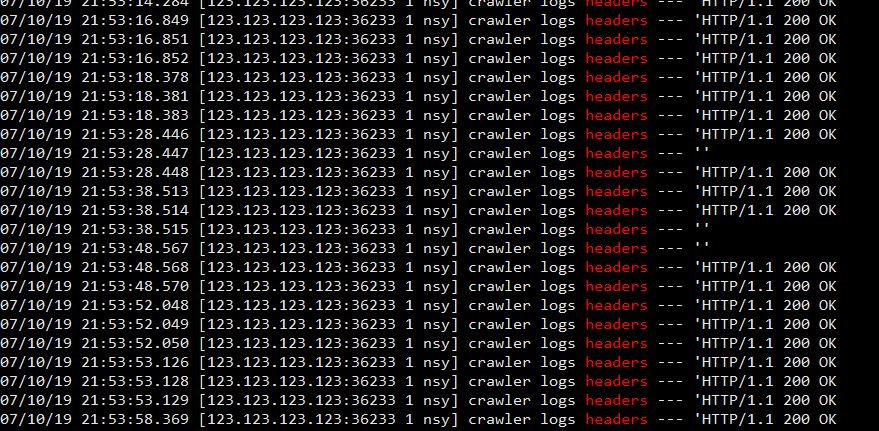
Now after a manual crawling , let's check the debug.log by grep headers /path/to/wordpress/wp-content/debug.log
So here is the problem , most of logs shows header is HTTP/1.1 200 OK but some headers are empty, that's the reason why it is being added into blacklist.
But why if manually run a curl , it just works as normal ?
[root@test ~]# curl -I -XGET https://example.com/product-name-1
HTTP/1.1 200 OK
Date: Thu, 11 Jul 2019 20:57:54 GMT
Content-Type: text/html; charset=UTF-8
Transfer-Encoding: chunked
Connection: keep-alive
Set-Cookie: __cfduid=some-string-here; expires=Fri, 10-Jul-20 20:57:43 GMT; path=/; domain=.example.com; HttpOnly
Cf-Railgun: direct (starting new WAN connection)
Link: <https://example.com/wp-json/>; rel="https://api.w.org/"
Link: </min/186a9.css>; rel=preload; as=style,</min/f7e97.css>; rel=preload; as=style,</wp-content/plugins/plugin/jquery.min.js>; rel=preload; as=script,</min/7f44e.js>; rel=preload; as=script,</min/a8512.js>; rel=preload; as=script,</wp-content/plugins/litespeed-cache/js/webfontloader.min.js>; rel=preload; as=script
Set-Cookie: wp_woocommerce_session_string=value; expires=Sat, 13-Jul-2019 20:57:43 GMT; Max-Age=172799; path=/; secure; HttpOnly
Set-Cookie: wp_woocommerce_session_string=value; expires=Sat, 13-Jul-2019 20:57:43 GMT; Max-Age=172799; path=/; secure; HttpOnly
Vary: Accept-Encoding
X-Litespeed-Cache: miss
X-Litespeed-Cache-Control: public,max-age=604800
X-Litespeed-Tag: 98f_WC_T.156,98f_WC_T.494,98f_WC_T.48,98f_product_cat,98f_URL.e3a528ab8c54fd1cf6bf060091288580,98f_T.156,98f_
X-Powered-By: PHP/7.3.6
Expect-CT: max-age=604800, report-uri="https://report-uri.cloudflare.com/cdn-cgi/beacon/expect-ct"
Server: cloudflare
CF-RAY: 5f5db4fd1c234c56-AMS
It returns 200 OK , and `x-litespeed-cache-control: public` , so why header is empty in previous debugging process?
So what to do next ?
Naturally , we will now need to mimic the exact options the PHP curl used and see what's going on.
Add another debug log code to grab the curl options crawler used, add following code into litespeed-cache/lib/litespeed/litespeed-crawler.class.php , in line 627 , before return $options ;
		$options[ CURLOPT_COOKIE ] = implode( '; ', $cookies ) ;
		LiteSpeed_Cache_Log::debug( 'crawler logs headers2', json_encode( $options ) ) ;
		return $options ;
Now let's manually crawl it again to get the all the options.
07/11/19 14:20:15.374 [123.123.123.123:37386 1 ZWh] crawler logs headers2 --- '{
"19913":true,
"42":true,
"10036":"GET",
"52":false,
"10102":"gzip",
"78":10,
"13":10,
"81":0,
"64":false,
"44":false,
"10023":["Cache-Control: max-age=0","Host: example.com"],
"84":2,
"10018":"lscache_runner ",
"10016":"http:\/\/example.com\/wp-cron.php?doing_wp_cron=1234567890.12345678910111213141516","10022":"litespeed_hash=qwert"
}'
These numbers are PHP curlset reference code , after some googling , the 78 and 13 are particularly interesting , they represent curl connection timeout and curl timeout
Let's apply these otpions into our curl command.
[root@test ~]# curl -I -XGET --max-time 10 https://example.com/product-name-1
curl: (28) Operation timed out after 10001 milliseconds with 0 out of -1 bytes received
So this is the root cause , the page without cache takes more than 10 seconds to load.
Let's do more test to confirm it
[root@test ~]# curl -w 'Establish Connection: %{time_connect}s\nTTFB: %{time_starttransfer}s\nTotal: %{time_total}s\n' -XGET -A "lscache_runner https://example.com/product-name-1/
Establish Connection: 0.006s
TTFB: 16.455s
Total: 16.462s
So yes , the page without cache takes more than 16 seconds to load which hit curl timeout, that is the reason why debug log shows empty header.
Solution:
We now need to figure out where the timeout is set by grep
[root@test litespeed-cache]# grep -riF "timeout" --include="*crawler*.php"
includes/litespeed-cache-crawler.class.php:             $response = wp_remote_get( $sitemap, array( 'timeout' => 15 ) ) ;
inc/crawler.class.php:          $response = wp_remote_get( $sitemap, array( 'timeout' => 15 ) ) ;
lib/litespeed/litespeed-crawler.class.php:                      CURLOPT_CONNECTTIMEOUT => 10,
lib/litespeed/litespeed-crawler.class.php:                      CURLOPT_TIMEOUT => 10,
So the last result , shows curl timeout is defined there, open file `litespeed-cache/lib/litespeed/litespeed-crawler.class.php` , around line 561-572
			CURLOPT_RETURNTRANSFER => true,
			CURLOPT_HEADER => true,
			CURLOPT_CUSTOMREQUEST => 'GET',
			CURLOPT_FOLLOWLOCATION => false,
			CURLOPT_ENCODING => 'gzip',
			CURLOPT_CONNECTTIMEOUT => 10,
			CURLOPT_TIMEOUT => 10,
			CURLOPT_SSL_VERIFYHOST => 0,
			CURLOPT_SSL_VERIFYPEER => false,
			CURLOPT_NOBODY => false,
			CURLOPT_HTTPHEADER => $this->_curl_headers,
Raise timeout from 10 to higher number , like 30 seconds.
Manual crawling again , all these previous blacklisted URIs are not longer being added into blacklist.
This is a temporarily solution by manually edit the code to raise timeout , default timeout will be changed to 30 seconds in LSCWP 2.9.8.4 , and will be made configurable in LSCWP 3.0 in case user may need a longer time.
