Hello,
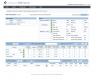
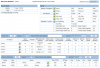
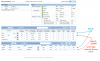
We are using LiteSpeed Web Server Enterprise 5.2.8 on a CentOS 6.9 server. Sometimes one of the site isn't responding. When I check, I'm seeing a lot of (~400 lines) "lsphp5" instances in "ps ax" command printout:
Load average: 0.16, 0.12, 0.09
Is it DDoS attack? Would you please suggest anything for that? I tried latest version 5.3.5 and no change.
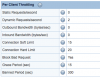
Per Client Throttling settings:
Thank you.
We are using LiteSpeed Web Server Enterprise 5.2.8 on a CentOS 6.9 server. Sometimes one of the site isn't responding. When I check, I'm seeing a lot of (~400 lines) "lsphp5" instances in "ps ax" command printout:
PID TTY      STAT   TIME COMMAND

    1 ?        Ss     0:18 /sbin/init

...

 6101 ?        Ss     0:00 lsphp5:/vhosts/site1.com/httpdocs/index.php

 6121 ?        Ss     0:00 lsphp5:/vhosts/site1.com/httpdocs/index.php

 6320 ?        Ss     0:00 lsphp5:/vhosts/site1.com/httpdocs/index.php

 6321 ?        Ss     0:00 lsphp5:/vhosts/site1.com/httpdocs/index.php

 6380 ?        Ss     0:00 lsphp5:/vhosts/site1.com/httpdocs/index.php

 6729 ?        Ss     0:00 lsphp5:/vhosts/site1.com/httpdocs/index.php

 6784 ?        Ss     0:00 lsphp5:/vhosts/site1.com/httpdocs/index.php

 6800 ?        Ss     0:00 lsphp5:/vhosts/site1.com/httpdocs/index.php

 6801 ?        Ss     0:00 lsphp5:/vhosts/site1.com/httpdocs/index.php

 6802 ?        Ss     0:00 lsphp5:/vhosts/site1.com/httpdocs/index.php

 6832 ?        Ss     0:00 lsphp5:/vhosts/site1.com/httpdocs/index.php

 6877 ?        Ss     0:00 lsphp5:/vhosts/site1.com/httpdocs/index.php

 6878 ?        Ss     0:00 lsphp5:/vhosts/site1.com/httpdocs/index.php

....

 7094 ?        Ss     0:00 lsphp5:/vhosts/site1.com/httpdocs/index.php

 7095 ?        Ss     0:00 lsphp5:/site1.com/httpdocs/mobile/index.php

 7096 ?        Ss     0:00 lsphp5:/vhosts/site1.com/httpdocs/index.php

 7097 ?        Ss     0:00 lsphp5:/vhosts/site1.com/httpdocs/index.php

 7098 ?        Ss     0:00 lsphp5:/vhosts/site1.com/httpdocs/index.php

 7110 ?        Ss     0:00 lsphp5:/vhosts/site1.com/httpdocs/index.php

 7111 ?        Ss     0:00 lsphp5:/vhosts/site1.com/httpdocs/index.php

 7112 ?        Ss     0:00 lsphp5:/vhosts/site1.com/httpdocs/index.php

 7113 ?        Ss     0:00 lsphp5:/vhosts/site1.com/httpdocs/index.php

 7114 ?        Ss     0:00 lsphp5:/vhosts/site1.com/httpdocs/index.php

 7115 ?        Ss     0:00 lsphp5:/vhosts/site1.com/httpdocs/index.php

 7116 ?        Ss     0:00 lsphp5:/vhosts/site1.com/httpdocs/index.php

 7117 ?        Ss     0:00 lsphp5:/vhosts/site1.com/httpdocs/index.php

 7118 ?        Ss     0:00 lsphp5:/vhosts/site1.com/httpdocs/index.php

 7119 ?        Ss     0:00 lsphp5:/vhosts/site1.com/httpdocs/index.php

 7120 ?        Ss     0:00 lsphp5:/vhosts/site1.com/httpdocs/index.php

 7123 ?        Ss     0:00 lsphp5:/vhosts/site1.com/httpdocs/index.php

 7124 ?        Ss     0:00 lsphp5:/vhosts/site1.com/httpdocs/index.php

 7125 ?        Ss     0:00 lsphp5:/vhosts/site1.com/httpdocs/index.php

 7126 ?        Ss     0:00 lsphp5:/vhosts/site1.com/httpdocs/index.php

 7127 ?        Ss     0:00 lsphp5:/vhosts/site1.com/httpdocs/index.php

 7128 ?        Ss     0:00 lsphp5:/vhosts/site1.com/httpdocs/index.php

 7129 ?        Ss     0:00 lsphp5:/vhosts/site1.com/httpdocs/index.php

 7130 ?        Ss     0:00 lsphp5:/site1.com/httpdocs/mobile/index.php

 7131 ?        Ss     0:00 lsphp5:/vhosts/site1.com/httpdocs/index.php

 7132 ?        S      0:25 lsphp5

 ....

22927 ?        Ss     0:00 lsphp5:/vhosts/site1.com/httpdocs/index.php

22928 ?        Ss     0:00 lsphp5:/vhosts/site1.com/httpdocs/index.php

22929 ?        Ss     0:00 lsphp5:/site1.com/httpdocs/mobile/index.php

22930 ?        Ss     0:00 lsphp5:/vhosts/site1.com/httpdocs/index.php

22931 ?        Ss     0:00 lsphp5:/vhosts/site1.com/httpdocs/index.php

22932 ?        Ss     0:00 lsphp5:/vhosts/site1.com/httpdocs/index.php

22933 ?        Ss     0:00 lsphp5:/vhosts/site1.com/httpdocs/index.php

22978 ?        Ss     0:00 lsphp5:/vhosts/site1.com/httpdocs/index.php

22979 ?        Ss     0:00 lsphp5:/vhosts/site1.com/httpdocs/index.php

22980 ?        Ss     0:00 lsphp5:/vhosts/site1.com/httpdocs/index.php

22981 ?        Ss     0:00 lsphp5:/vhosts/site1.com/httpdocs/index.php

23017 ?        Ss     0:00 lsphp5:/vhosts/site1.com/httpdocs/index.php

23018 ?        Ss     0:00 lsphp5:w/vhosts/site1.com/httpdocs/ajax.php

23019 ?        Ss     0:00 lsphp5:/vhosts/site1.com/httpdocs/index.php

23020 ?        Ss     0:00 lsphp5:/vhosts/site1.com/httpdocs/index.php

23052 ?        Ss     0:00 lsphp5:/vhosts/site1.com/httpdocs/index.php

23085 ?        Ss     0:00 lsphp5

23138 ?        Ss     0:00 lsphp5

23147 ?        Ss     0:00 lsphp5

23159 ?        Ss     0:00 lsphp5

23163 ?        Ss     0:00 lsphp5

23164 ?        Ss     0:00 lsphp5

23165 ?        Ss     0:00 lsphp5

25367 ?        S      0:15 litespeed (lshttpd)

25372 ?        S      0:02 lscgid

25373 ?        S      0:02 httpd (lscgid)

25386 ?        Sl   340:39 litespeed (lshttpd)
Load average: 0.16, 0.12, 0.09
Is it DDoS attack? Would you please suggest anything for that? I tried latest version 5.3.5 and no change.
Per Client Throttling settings:
Thank you.