Litesped 3.3.24 trial and high load

Bono

Well-Known Member
#1
First I would like to say that I heard extremely good things about litespeed web server, so I got few questions and i hope somebody can figure it out.

I run one relatively big site, 1 bil. hits per month and lately i'm experiencing attacks on my site, it is no longer syn flood but by looks of it bot net is forcing reload of my site. So i thought it is best time to try litespeed trial version to see if it can cope with my traffic.

My setup: Xeon 3060 (db and web on same box) 4GB of ram
Software: Cpanel 11 Apache 2.2.11 (prefork) with PHP 5.2.8 and Xcache 1.2.2

Litespeed is like i said latest trial version 3.3.24 with compiled PHP 5.2.8 and it looks like Xcache is loaded also.
First thing that happened after I have loaded Litespeed was huge load 12 istead of 3 which is also high for this part of the day.


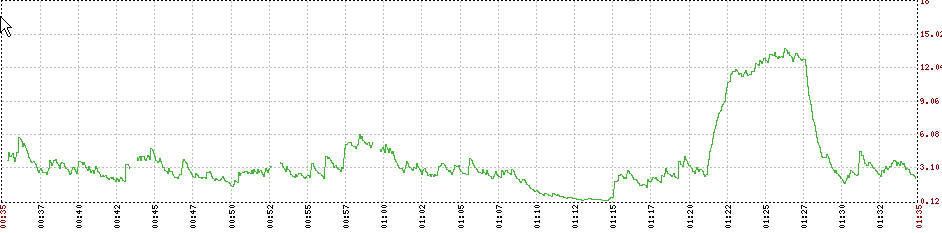
This is picture of load when litespeed was loaded, i dont need to see that site was unresponsive, i could load forum but if i wanted to go to subsection i would get server is busy. In php info it says xcache is loaded but when i loaded forum it says xcache variables are missing so that is broken too.

Please advince what can I do, I have 13 more days of trial so I would like to switch if it will work better than my current apache setup.

I'm sorry because of so big post, but i'm still in shock because of load, I have expected 0.50 and i got 12.

More info:

mysql 15666 25.1 8.3 496100 348552 ? S<l 2008 12032:55
root 9161 0.1 0.0 5976 2848 ? S 01:23 0:00 lshttpd
nobody 9163 0.4 0.0 6976 3392 ? S 01:23 0:00 \_ lshttpd
user1 9320 12.7 0.2 20596 10484 ? RN 01:23 0:00 | \_ lsphp5
user1 9322 12.6 0.2 20596 10500 ? RN 01:23 0:00 | \_ lsphp5
user1 9328 28.5 0.2 20324 10396 ? RN 01:23 0:00 | \_ lsphp5
user1 9329 23.5 0.2 20320 10348 ? RN 01:23 0:00 | \_ lsphp5
user1 9330 18.5 0.2 20596 10432 ? RN 01:23 0:00 | \_ lsphp5
user1 9331 22.0 0.2 20596 10468 ? RN 01:23 0:00 | \_ lsphp5
user2 9332 0.0 0.0 12144 2084 ? RN 01:23 0:00 | \_ lsphp5
user1 9334 0.0 0.0 12132 1868 ? RN 01:23 0:00 | \_ lsphp5
user1 9335 8.0 0.2 20340 10256 ? RN 01:23 0:00 | \_ lsphp5
user1 9337 6.0 0.1 17612 7596 ? RN 01:23 0:00 | \_ lsphp5
user1 9344 0.0 0.2 20596 10340 ? RN 01:23 0:00 | \_ lsphp5
nobody 9164 0.0 0.0 6024 2652 ? S 01:23 0:00 \_ lshttpd
Server log viewer: Log Size: 325,507.43 KB

In logs i see also bunch of this: 503 Service Unavailable
2009-01-21 01:50:52.417 [NOTICE] The maximum number of file descriptor limit is set to 6000.
2009-01-21 01:50:52.417 [NOTICE] [config:server:epsr:lsphp5]'Process Limit' probably is too low, adjust the limit to: 310.
2009-01-21 01:50:52.417 [NOTICE] [config:server:epsr:lsphp4]'Process Limit' probably is too low, adjust the limit to: 310.
 
Last edited:

anewday

Well-Known Member
#2
Did you "Build Matching PHP Binary" in Cpanel? Maybe you can try disabling xcache temporarily. Can you post the output of top when it's high load?

Your trial can be extended if you ask mistwang (George). :)
 

mistwang

LiteSpeed Staff
#3
Can you show me your xcache configuration in php.ini?
I think the memory limit for lsphp5 may be too low, so it cause 503 errors.

For single large web site, it is better disabling PHP suEXEC.

Test LiteSpeed on another port with an Apache port offset, make sure xcache is working then switch to LiteSpeed from Apache.
 

Bono

Well-Known Member
#4
Can you show me your xcache configuration in php.ini?
I think the memory limit for lsphp5 may be too low, so it cause 503 errors.

For single large web site, it is better disabling PHP suEXEC.

Test LiteSpeed on another port with an Apache port offset, make sure xcache is working then switch to LiteSpeed from Apache.
Xcache now works, but as you see load is really high, so it is probably ddos or alot of reloading my page, where can i find ddos settings?

I have lowered PHP, and in lsphp5 i have put higher settings:
Memory Soft Limit (bytes)
450M
Memory Hard Limit (bytes)
500M
Process Soft Limit
400
Process Hard Limit

500


27513 nobody 22 1 276m 9248 6432 R 50.8 0.2 0:12.25 lsphp5
27818 nobody 22 1 276m 8232 5504 R 36.8 0.2 0:00.37 lsphp5
27820 nobody 21 1 276m 8044 5320 R 27.9 0.2 0:00.28 lsphp5
15666 mysql 10 -5 486m 341m 3768 S 25.9 8.4 12134:28 mysqld
27127 nobody 21 1 276m 11m 9400 R 19.9 0.3 0:22.94 lsphp5
27695 nobody 22 1 275m 11m 9m S 13.9 0.3 0:05.64 lsphp5
27693 nobody 21 1 275m 11m 9252 S 8.0 0.3 0:05.48 lsphp5
27125 nobody 17 1 275m 13m 11m S 7.0 0.3 0:18.74 lsphp5
27696 nobody 16 1 275m 11m 9.8m S 4.0 0.3 0:06.77 lsphp5
27684 nobody 16 1 275m 10m 9240 S 2.0 0.3 0:05.05 lsphp5
18032 named 25 0 72652 33m 1956 S 1.0 0.8 15:00.25 named
27122 nobody 15 0 8604 5304 1416 S 1.0 0.1 0:01.21 lshttpd
27610 nobody 17 1 275m 11m 9616 S 1.0 0.3 0:04.99 lsphp5
My nice value is also high: Cpu(s): 18.5% us, 10.0% sy, 71.5% ni, 0.0% id, 0.0% wa, 0.0% hi, 0.0% si
 
Last edited:

Bono

Well-Known Member
#5
Little update, my site is now under heavy load and it looks like apache works better than lite speed.
Lite speed did 40-50 transactions per sec and max load was 45, and apache 2.2.11 does 120 transactions per second and load goes up to 110. But with apache site is more responsive than with lite speed.

114 requests currently being processed, 45 idle workers
193 requests currently being processed, 0 idle workers

DDos protection build in lite speed didn't helped much, i have set 1 transaction per second for dynamic and 10 for static, and load was still high and site was more or less unresponsive.
 

Bono

Well-Known Member
#7
I think something must be wrong with your setup. I never saw a case where Apache would give lower load than litespeed.

Have you set these: http://www.litespeedtech.com/how-tos.html#qa_dos

Maybe you can give root access to mistwang to look into it further.
I was wrong, apache worked better first 5 minutes and then load went to 200. So Lite speed performs better but i'm just stuck with heavy attack.

Atm box is doing 70 req per sec and 40 are waiting in queue.


Code:
top - 16:51:55 up 88 days,  8:42,  1 user,  load average: 43.87, 45.77, 39.54
Tasks: 149 total,  27 running, 122 sleeping,   0 stopped,   0 zombie
Cpu(s):  5.7% us,  6.9% sy, 87.4% ni,  0.0% id,  0.0% wa,  0.0% hi,  0.0% si
Mem:   4151296k total,  3382500k used,   768796k free,   286668k buffers
Swap:  2040212k total,      144k used,  2040068k free,  2230652k cached

  PID USER      PR  NI  VIRT  RES  SHR S %CPU %MEM    TIME+  COMMAND                                                                
15666 mysql     10  -5  523m 368m 3768 S 22.9  9.1  12308:41 mysqld                                                                 
30917 nobody    20   1  276m 8456 5756 R 18.9  0.2   0:01.70 lsphp5                                                                 
30767 nobody    26   1  276m 9916 7176 R 10.9  0.2   0:03.04 lsphp5                                                                 
29855 nobody    26   1  276m  12m 9860 R  9.9  0.3   0:14.34 lsphp5                                                                 
30516 nobody    26   1  276m  11m 8992 R  9.9  0.3   0:06.55 lsphp5                                                                 
30713 nobody    26   1  276m 8948 6280 R  9.9  0.2   0:03.80 lsphp5                                                                 
30739 nobody    26   1  276m  11m 8960 R  9.9  0.3   0:02.94 lsphp5                                                                 
30916 nobody    25   1  276m 9028 6328 R  9.9  0.2   0:01.13 lsphp5                                                                 
30932 nobody    25   1  276m 8464 5760 R  9.9  0.2   0:01.16 lsphp5                                                                 
29629 nobody    26   1  276m  13m  10m R  8.9  0.3   0:17.28 lsphp5                                                                 
29678 nobody    25   1  276m  12m  10m S  8.9  0.3   0:12.72 lsphp5                                                                 
30126 nobody    23   1  276m  12m  10m R  8.9  0.3   0:15.42 lsphp5                                                                 
30472 nobody    26   1  276m  11m 8940 R  8.9  0.3   0:07.97 lsphp5                                                                 
30493 nobody    26   1  276m  11m 9368 R  8.9  0.3   0:08.16 lsphp5                                                                 
30495 nobody    26   1  276m  13m  10m R  8.9  0.3   0:06.83 lsphp5                                                                 
30618 nobody    26   1  276m  11m 9408 R  8.9  0.3   0:06.47 lsphp5                                                                 
30912 nobody    25   1  276m 8848 6148 R  8.9  0.2   0:01.32 lsphp5                                                                 
30688 nobody    26   1  275m 9864 7892 S  5.0  0.2   0:05.45 lsphp5                                                                 
30765 nobody    26   1  275m  11m 9956 S  5.0  0.3   0:03.76 lsphp5                                                                 
30885 nobody    18   1  276m 8788 6360 S  2.0  0.2   0:01.06 lsphp5                                                                 
13174 nobody    15   0 10588 7252 2448 S  1.0  0.2   0:36.48 lshttpd                                                                
28169 root      16   0  3036 1052  768 R  1.0  0.0   0:05.45 top                                                                    
29706 nobody    26   1  275m  11m 9964 S  1.0  0.3   0:18.24 lsphp5                                                                 
30585 nobody    26   1  276m  11m 9004 R  1.0  0.3   0:05.71 lsphp5                                                                 
30766 nobody    26   1  275m 8156 6212 S  1.0  0.2   0:04.09 lsphp5                                                                 
30894 nobody    23   1  276m 8952 6280 R  1.0  0.2   0:01.52 lsphp5
 

anewday

Well-Known Member
#8
27513 nobody 22 1 276m 9248 6432 R 50.8 0.2 0:12.25 lsphp5
27818 nobody 22 1 276m 8232 5504 R 36.8 0.2 0:00.37 lsphp5
27820 nobody 21 1 276m 8044 5320 R 27.9 0.2 0:00.28 lsphp5
15666 mysql 10 -5 486m 341m 3768 S 25.9 8.4 12134:28 mysqld
27127 nobody 21 1 276m 11m 9400 R 19.9 0.3 0:22.94 lsphp5
27695 nobody 22 1 275m 11m 9m S 13.9 0.3 0:05.64 lsphp5
27693 nobody 21 1 275m 11m 9252 S 8.0 0.3 0:05.48 lsphp5
27125 nobody 17 1 275m 13m 11m S 7.0 0.3 0:18.74 lsphp5
27696 nobody 16 1 275m 11m 9.8m S 4.0 0.3 0:06.77 lsphp5
27684 nobody 16 1 275m 10m 9240 S 2.0 0.3 0:05.05 lsphp5
18032 named 25 0 72652 33m 1956 S 1.0 0.8 15:00.25 named
27122 nobody 15 0 8604 5304 1416 S 1.0 0.1 0:01.21 lshttpd
27610 nobody 17 1 275m 11m 9616 S 1.0 0.3 0:04.99 lsphp5

My nice value is also high: Cpu(s): 18.5% us, 10.0% sy, 71.5% ni, 0.0% id, 0.0% wa, 0.0% hi, 0.0% si
According to mistwang, "CPU spikes are normal due to the fact that LiteSpeed only use a handful persistent PHP process to handle all PHP requests."

http://www.litespeedtech.com/support/forum/showthread.php?p=9660&highlight=persistent#post9660
 

anewday

Well-Known Member
#10
Also, in real-time stats, "External Application" Look under the WaitQ column, if it's higher than 0 then you'll need to raise your max connections.
 

Bono

Well-Known Member
#11
Here it is, just in case if you need it i will paste you my memory usage:
total used free shared buffers cached
Mem: 4054 3329 724 0 282 2232
-/+ buffers/cache: 815 3238
Swap: 1992 0 1992
Code:
Name	 	lsphp5
Address	 	uds://tmp/lshttpd/lsphp5.sock
Max Connections 35
Environment PHP_LSAPI_MAX_REQUESTS=500
PHP_LSAPI_CHILDREN=35
Initial Request Timeout (secs) 60
Retry Timeout (secs) 	0
Persistent Connection	No
Connection Keepalive Timeout	Not Set
Response Buffering	No
Auto Start	Yes
Command		$SERVER_ROOT/fcgi-bin/lsphp5
Back Log	100
Instances	1
Run On Start Up		Not Set
Max Idle Time		Not Set
Priority		Not Set
Memory Soft Limit (bytes)	450M
Memory Hard Limit (bytes)	500M
Process Soft Limit		400
Process Hard Limit		500
 

anewday

Well-Known Member
#12
Try setting persistent connection to Yes and raise max connections and PHP_LSAPI_CHILDREN to 60 or higher. Also, check the last post on Page 1.
 

Bono

Well-Known Member
#13
Try setting persistent connection to Yes and raise max connections and PHP_LSAPI_CHILDREN to 60 or higher. Also, check the last post on Page 1.
Answer to the last post on the first page is zero, nothing is waiting. And i have applied those two values so now i need look and see if it will help.

It looks like that didn't helped much:

top - 19:33:16 up 88 days, 11:23, 1 user, load average: 68.72, 61.33, 44.86
Tasks: 191 total, 86 running, 105 sleeping, 0 stopped, 0 zombie
Cpu(s): 26.2% us, 17.8% sy, 55.9% ni, 0.0% id, 0.0% wa, 0.0% hi, 0.0% si
Mem: 4151296k total, 3718644k used, 432652k free, 298232k buffers
Swap: 2040212k total, 144k used, 2040068k free, 2445288k cached

PID USER PR NI VIRT RES SHR S %CPU %MEM TIME+ COMMAND
15666 mysql 10 -5 531m 371m 3768 S 81.4 9.2 12377:26 mysqld
22551 nobody 19 1 276m 8084 5324 R 12.9 0.2 0:00.28 lsphp5
22549 nobody 19 1 276m 7996 5316 R 11.9 0.2 0:00.14 lsphp5
22550 nobody 19 1 276m 8512 5596 R 11.9 0.2 0:00.13 lsphp5
22546 nobody 19 1 276m 8552 5872 R 9.9 0.2 0:00.13 lsphp5
22547 nobody 19 1 276m 7996 5316 R 9.9 0.2 0:00.13 lsphp5
22265 nobody 17 1 275m 8144 6200 S 7.9 0.2 0:04.09 lsphp5
22548 nobody 19 1 276m 7988 5308 R 7.9 0.2 0:00.11 lsphp5
22271 nobody 19 1 276m 12m 9.8m R 4.0 0.3 0:04.01 lsphp5
22476 nobody 19 1 276m 10m 8000 R 4.0 0.3 0:00.75 lsphp5
22499 nobody 19 1 276m 10m 8332 R 4.0 0.3 0:00.75 lsphp5
22261 nobody 18 1 276m 10m 8092 R 3.0 0.3 0:03.36 lsphp5
22540 nobody 19 1 276m 8000 5324 R 3.0 0.2 0:00.13 lsphp5
20638 nobody 17 1 276m 29m 27m S 2.0 0.7 0:05.54 lsphp5
21895 nobody 17 1 276m 17m 15m S 2.0 0.4 0:02.95 lsphp5
22270 nobody 18 1 276m 11m 8780 R 2.0 0.3 0:02.99 lsphp5
22278 nobody 19 1 276m 8484 5784 R 2.0 0.2 0:03.41 lsphp5
22364 nobody 18 1 276m 8912 6208 R 2.0 0.2 0:01.95 lsphp5
22462 nobody 18 1 276m 8892 6192 R 2.0 0.2 0:00.61 lsphp5
22489 nobody 18 1 276m 8376 5680 R 2.0 0.2 0:00.62 lsphp5
22493 nobody 18 1 276m 8896 6200 R 2.0 0.2 0:00.62 lsphp5
22498 nobody 18 1 276m 10m 8324 R 2.0 0.3 0:00.68 lsphp5
22500 nobody 18 1 276m 8652 5728 R 2.0 0.2 0:00.62 lsphp5
22542 nobody 18 1 276m 7856 5216 R 2.0 0.2 0:00.02 lsphp5
21162 nobody 16 1 276m 24m 21m S 1.0 0.6 0:04.46 lsphp5
22558 nobody 18 1 275m 7368 4996 R 1.0 0.2 0:00.01 lsphp5
22559 nobody 18 1 275m 7180 4860 R 1.0 0.2 0:00.01 lsphp5
 
Last edited:

anewday

Well-Known Member
#14
I don't know what else you can do, wait for mistwang's reply. How many req/s do you see in real-time stats?
 
Last edited:

Bono

Well-Known Member
#15
I don't know what else you can do, wait for mistwang's reply. How many req/s do you see in real-time stats?
ATM 188 req/s outgoing 632KB/sec. :eek:

I'm under big attack so it's not best time to switch, but i don't have any choice apache dies after few minutes.
 

anewday

Well-Known Member
#16
It's not that much. Did you set these under Security tab?

Outbound Bandwidth (bytes/sec)
Inbound Bandwidth (bytes/sec)

May be worth a try.
 

Bono

Well-Known Member
#17
It's not that much. Did you set these under Security tab?

Outbound Bandwidth (bytes/sec)
Inbound Bandwidth (bytes/sec)

May be worth a try.
Yea I have tried that too, but my main problem is extremely high load and too many mysql threads. I will see over night if load will be lower.
 

Bono

Well-Known Member
#19
Maybe the bottleneck lies elsewhere, not the webserver. Is your mysql on a separate hdd/server?
No same, but there is no iowait. It is just that somebody is attacking and lite speed can't help me much. Only good thing is that it doesn't lock like apache.

Code:
 r  b   swpd   free   buff  cache   si   so    bi    bo   in    cs us sy id wa
47  0    144 262292 306640 2649820    0    0    29    16    3     0 16  7 76  1
56  0    144 260628 306640 2650080    0    0     3   184 1370  1214 87 13  0  0
60  0    144 256212 306640 2650080    0    0     1   165 1286  1205 84 16  0  0
61  0    144 253716 306640 2650080    0    0     0   204 1217  1042 90 10  0  0
70  0    144 244676 306648 2650592    0    0     0   411 1492  1369 84 16  0  0
73  0    144 241396 306652 2650328    0    0     0   279 1399  1354 89 11  0  0
78  0    144 231540 306656 2650584    0    0     1   188 1477  1351 88 12  0  0
87  0    144 213172 306656 2650584    0    0     0   117 1197  1064 84 16  0  0
 

anewday

Well-Known Member
#20
What did you set for connection soft, hard and grace period? How many IPs are attacking and how big? I hope you have a firewall installed to block the offenders.

My site got hit with a ddos from 20 different IPs 2 weeks ago and the forum was still running fine with load of 15, though it was slower than normal. Server is a Xeon 3060 with 3GB of memory. Mysql on a separate drive.
 
Top