Am I Starving LSWS?

Balerion

Active Member
#1
After many trials and errors, my Mediawiki install seemed to finally be on a good footing, with load on our 8 core server being between about 1 to 2-ish generally. Then, for no apparent reason, after several days of being fine, load suddenly ramped up wildly. Initial diagnosis from our tech people was high traffic from the Bytedance and Bytespider botnet. We blocked that, and a couple of others. Load fell.. but only a little.

I have since tried a number of things, like switching from PHP 8.2 to PHP 7.4, and that seems to be much better. But why? It worked for days, then stopped working well, and I don't know why. And it's not like 7.4 is perfect, either -- even modest loads can push it to 7.0 to 8-ish, which means 100% CPU usage. Right now it's sitting at 6.5 average load with an average of 30 requests per second, of which the vast majority are going to cache. This _should_ be a piece of cake for this server and LSWS.

So, this brings me around to the title: am I starving LSWS of RAM? The one thing I have noticed during all of this, even the one time load shot up to a reported 100, and MySQL connections were at 275, so there were hundreds of requests, used RAM barely budged above 12GB (on a 64GB server), and factoring in the 3GB used by MariaDB and the 4GB used by Redis, that meant that LSWS and its PHP processes were actually only touching something around 5GB of RAM.

On the one hand, the extremely efficient resource use of LSWS is great. But on the other hand, there _is_ (a lot) more RAM available and it should use it when it needs it to speed up processing of requests.

Further, why would 8.2 work so well and then suddenly turn terrible? I can't see any obvious errors in logs that would explain this. I'm considering recompiling 8.2 just to see if maybe there's some random corruption, but that seems a long shot.

General configuration notes:

Computer: E3-1260 v4, 64GB RAM, SSD drives
LSWS: Using LS Cache with Mediawiki plugin, LSWS version 6.1.1 (rolled back from 6.2.1 just to see if that affected anything.

Server > General: PHP suEXEC Max Conn = 200
Server > Tuning: Max Connections & Max SSL Connections = 1000, Connection Timeout = 30 secs, Max Keep-Alive Requests = 10000, Keep-alive Timeout = 5, HTTP3/QUIC = Yes
Server > Cache: Cache Features = On and Crawler (taking off Crawler made no change to the issues we're having)
Server > PHP: Environment = PHP_LSAPI_CHILDREN = 500 and LSAPI_AVOID_FORK = 1, Max Connections = 1500, Initial Request Timeout = 60, Connection Keepalive Timeout = 1, Max Idle Time = 86400, Memory Soft/Hard Limit = 2047M, Process Soft Limit = 400, Process Hard Limit = 500

Server > External App > PHP74: Max Connections = 1500, Environment = PHP_LSAPI_CHILDREN = 1500, Persistent Connection + Yes (changing this made no difference)

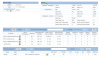
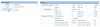
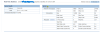
ETA: Attaching an image after a recent graceful restart to give a sense ofw hat I'm seeing. Any tips for how to improve our situation are very welcome! I know LSWS can do way better than it is doing right now, so it's surely my fault somehow, but I'm at a loss to figure it out, as are the people who help manage the server for us.
 

Attachments

Last edited:

serpent_driver

Well-Known Member
#2
You should analyze your traffic more closely. In particular the traffic that is not generated by natural users. If the load increases and you are wondering about the height of the load, then there must be a reason for it. Nothing happens for no reason.

If you need suggestions on how to better analyze “unwanted requests,” in particular, I can give you a few tips that I use myself.
 

Balerion

Active Member
#3
I did get some tips on using logs and tail and such, but more ideas welcome.

That said, traffic levels seem totally normal now. 30 request a second, 90% of which go to cache, should not be causing these loads.
 

serpent_driver

Well-Known Member
#4
30 requests per second implies the assumption that you either run a porn site or promise your users that they can become millionaires in 30 days. I know the topic of your site, but I have no idea that this topic can inspire so many users. Therefore, and excuse my lack of imagination, I firmly assume that your apparently high server load is generated by traffic from which you have no advantage. Or to put it another way, you have a large number of requests that you could actually do without.

That's why I can only recommend again that you should analyze your site's traffic better. This could be done via the access_log, but the access_log does not differentiate between wanted and unwanted traffic.

However, there is a serious problem with traffic analysis. By using LScache, conventional methods of traffic analysis are eliminated because you can only use the access_log. To use other methods, the goal must be to distinguish "good" from "bad" traffic. The goal of this distinction is to exclude the cache from "bad" traffic so that only "good" traffic sees cached content. "Bad" traffic (that causes unnecessary server load) can either be excluded from caching or access can blocked (by CloudFlare that you already use). To exclude all other and possibly dubious traffic from caching. Only once you have made this differentiation will you be able to analyze the traffic more precisely and take appropriate measures.
 
Last edited:

Balerion

Active Member
#5
I know the topic of your site, but I have no idea that this topic can inspire so many users. Therefore, and excuse my lack of imagination, I firmly assume that your apparently high server load is generated by traffic from which you have no advantage. Or to put it another way, you have a large number of requests that you could actually do without.
Perhaps so and I will study that, but even having blocked bots and put Cloudflare in 'I'm Under Attack!" Mode, it has hardly made a difference to traffic or load levels. Most of our traffic is legitimate, near as I can tell.

I'm fairly convinced I've misconfigured something, but have no clue what.
 

Balerion

Active Member
#7
CF, using WAF rules.

It's possible that all the bots on the net have swarmed on to us because they noticed it is a new server, and that after a day or two all this will diminish, but in all honesty I know this server will be called on to do hundreds of requests per second come later this year, all legitimate traffic, and I'm concerned that the Litespeed "Enterprise" Web Server is not actually capable of this sort of traffic where a much less powerful server using NGINX+Varnish was able to handle it without complaint. The fact that a week ago it was totally fine and now it's not for no obvious reason also bothers me, but maybe it's the bot rush.

Is it _normal_ to have Litespeed having 70 or 80 processes running, and load hittitng 25+, and RAM usage never actually budges? I keep going back to the idea that I've failed to set something up and LSWS is starved for RAM.
 

serpent_driver

Well-Known Member
#8
CF, using WAF rules.
I also use CF WAF, but I would need a little more information if you want me to give you suggestions for improvements.

It's possible that all the bots on the net have swarmed on to us because they noticed it is a new server, and that after a day or two all this will diminish, but in all honesty I know this server will be called on to do hundreds of requests per second come later this year, all legitimate traffic, and I'm concerned that the Litespeed "Enterprise" Web Server is not actually capable of this sort of traffic where a much less powerful server using NGINX+Varnish was able to handle it without complaint. The fact that a week ago it was totally fine and now it's not for no obvious reason also bothers me, but maybe it's the bot rush.
You should be aware that there is indeed such a thing as a “bot rush”. This phenomenon mainly occurs with new hosts or newly registered domains. I have been observing this phenomenon for 20 years now and the only way I can explain this phenomenon is that either the hosting provider, the domain registrar or, for example, Let's Encrypt share the data via a new host.

If you write that something won't work, then you have to provide specific information about what isn't working. But I can assure you that LSWS can handle more traffic than nginx or Apache.

Is it _normal_ to have Litespeed having 70 or 80 processes running, and load hittitng 25+, and RAM usage never actually budges? I keep going back to the idea that I've failed to set something up and LSWS is starved for RAM.
If you're looking for the cause of this behavior, don't look for it in the LSWS settings. Above all, you should not change these settings if you are unable to qualify the changed settings under constant conditions. If the load increases above normal, then LSWS is not the cause, but usually PHP or MySql.
 

Balerion

Active Member
#9
If the load increases above normal, then LSWS is not the cause, but usually PHP or MySql.
So as I understand it, LSWS uses its LSPHP to run PHP, so ... isn't that where I should be looking, the PHP and external app settings in the control panel?

If not, what should I look at? Just PHP.ini?

The only issue I have with MySQL at the moment is that I want to switch to use skip-name-resolve in case there's a DNS issue involved, but whenever I try it gets borked. I suspect I need to change the user account to list 127.0.0.1 but I haven't figured out how.
 

serpent_driver

Well-Known Member
#10
So as I understand it, LSWS uses its LSPHP to run PHP, so ... isn't that where I should be looking, the PHP and external app settings in the control panel?
LSPHP is PHP and not the webserver. Not every LiteSpeed product that has a LS prefix is 1 common LiteSpeed function.

If not, what should I look at? Just PHP.ini?
Why do you always search for the cause in settings? You must identify the CMS based process that causes errors, so keep the settings unchanged and search for true cause. Once you have found the true cause, you can make targeted adjustments. Everything else is trial and error, but without success.
 

Balerion

Active Member
#11
Believe me, I have been poring through logs. I even know an approximate time where everything went from perfect to bad, thanks to our ad provider who notified me of the issue while travelling -- it started happening around 2PM Eastern time on the 27th, and has persisted since then. So, too, have our managed server provider, who were the first to note that they felt the traffic issues were just due to bots, but actions against bots seemed to have little effect.
 

Balerion

Active Member
#13
Just noting that Litespeedtech is looking into it. Load without cache on is much, much lower than with cache on, for whatever reason:

Screenshot 2024-04-02 093520.png
 

serpent_driver

Well-Known Member
#14
Believe me, I have been poring through logs. I even know an approximate time where everything went from perfect to bad, thanks to our ad provider who notified me of the issue while travelling -- it started happening around 2PM Eastern time on the 27th, and has persisted since then. So, too, have our managed server provider, who were the first to note that they felt the traffic issues were just due to bots, but actions against bots seemed to have little effect.
Unless you are able to distinguish a natural user from a machine-driven user, your statements regarding bots are unfortunately not reliable.

FYI: In order to identify a bot or a machine-driven user, it takes more than just identifying the user agent. This means you miss 2/3 of all requests that pose as natural users.
 

Balerion

Active Member
#15
I also have Cloudflare's full managed ruleset and whatever voodoo they do, plus mod security running actively identifying malicious traffic.

But as you'll see above, the issue lies with LSWS/LS Cache and/or the Mediawiki LS Cache plugin, not bots. Taking off caching dropped load to under 1.0.
 

serpent_driver

Well-Known Member
#16
I also have Cloudflare's full managed ruleset and whatever voodoo they do, plus mod security running actively identifying malicious traffic.
CloudFlare is unsuitable for identifying bots and does not provide the necessary tools for this. I can bypass CF's WAF with minimal effort.

But as you'll see above, the issue lies with LSWS/LS Cache and/or the Mediawiki LS Cache plugin, not bots.
What is the issue?
 

Balerion

Active Member
#17
They don't know yet. It just seems that having the cache enabled causes load to rise significantly, sometimes spiking very high; where cache off has load running at 1.5-2 at peak hours (e.g. now), it was averaging 8-12 with cache on with spikes hitting up into the 30s or 40s for no obvious reason.

We're trying to get the 6.2.2 debug version installed to help the devs figure it out, but running into issues with it installing cleanly.
 

Balerion

Active Member
#18
Happy to report that Wuhua, developer of the Mediawiki plugin, fixed it. Turns out our wiki uses numerous and complicated templates, which before used to be information included in tags attached to cached files. The problem was that between our traffic and the complexity of pages, the process in the plugin to analyze and generate these tags simply took too long and lead to higher and higher load.

With this feature disabled, load immediately dropped and the cache worked perfectly, handling thousands of requests per second on a single cached page, tested via loader.io.

Only downside is changes to templates will require flushing the cache.
 
Last edited:
Top